As the last votes from election 2012 trickle in, people on both sides of the political divide have moved on from their initial reactions to the election towards planning for the future. But the questions of could-have should-have still linger in many people’s minds: could a change in effort or focus have switched the results?
To answer that, it’s good to know how close the election really was. We all know how many votes separate the two candidates, but apart from finding 3.5 million more declared, dedicated Romney voters, what would have changed the outcome? There’s a lot of what-ifs that people will play in their mind, and most are impossible to quantify. But one set of what-ifs are fairly easy to model: what if the demographics of the electorate had changed?
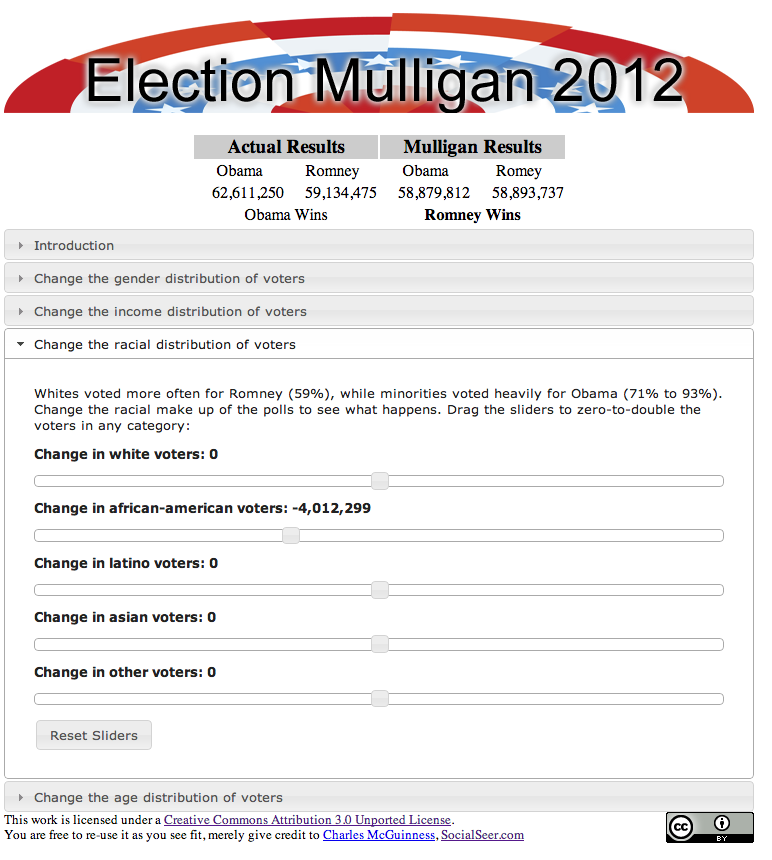
For example, what if the african-american vote had been lower? With enough fewer votes, Romney would have won:
About 4 million fewer african-american voters, and Romney could have won.
Want to play with the demographics yourself? You can! Just visit my Election Mulligan web page:
http://socialseer.com/apps/mulligan
You can test such things as changing the male/female balance in the votes, adding in more rich voters or removing poor voters, seeing what happens if more latinos vote, or reducing the youth vote. See what it takes to put Romney in the White House (if that’s your goal) or see how really hard it would have been for Romney’s Get-Out-The-Vote efforts to overcome Obama’s impressive campaign (if you like what happened)!
It’s fun, fast, and easy, And you may be surprised how hard it would be to change the election.
The data for this app is based upon election results updated to 11/21 and exit polls conducted at the time of the election. Note that exit polls are subject to error, and the results of this app are purely hypothetical.


This is sooooo great. Kudos Charles!